Outbound ROI model: from sends to meetings and revenue
Use an outbound ROI model to connect sends to meetings, opportunities, and revenue, with a spreadsheet-ready funnel template and simple formulas.
Why reply rate can be misleading
A high reply rate feels like proof outbound is working. But it’s easy to get “good” replies that don’t turn into meetings, opportunities, or revenue. If you track only replies, you end up celebrating noise.
A common example: you tweak subject lines and ask a yes-or-no question. Replies jump from 3% to 8%. Sounds great until you look closer and most responses are “not a fit,” “stop emailing me,” or “wrong person.” Reply rate went up, but your calendar is still empty.
Reply rate is an activity metric. It shows people reacted. It doesn’t show the reaction moved a deal forward. Outcome metrics connect to money: meetings held, qualified opportunities, and closed-won deals.
A practical fix is to stop treating all replies as equal. Split them into intent buckets: positive (willing to talk), neutral (questions, “maybe later”), negative (no, unsubscribe), and auto/out-of-office or bounced. Your model should run on the positive bucket, not the total.
Set expectations by starting with a simple spreadsheet, even if it feels “too basic.” Use a few rates you can measure and update weekly. Once you have real data, you can refine it by persona, offer, sequence, or channel without changing the core idea: activity only matters when it predicts outcomes.
The funnel stages that map to revenue
If you want an outbound ROI model that holds up, use stages that connect directly to money.
Start with emails delivered, not just emails sent. “Sent” includes messages that never reach an inbox because of bounces or blocks. “Delivered” is the real starting line.
Next, separate all replies from positive replies. “All replies” includes out-of-office, wrong person, not interested, and unsubscribe. Those signals are useful, but they don’t create pipeline. “Positive replies” are the subset that indicates intent to talk or learn more.
From there, track the steps sales teams actually feel:
- Meetings booked (prospects agree to a time)
- Meetings held (the call happens)
- Opportunities created (a real motion starts in your CRM)
- Deals closed (money arrives)
A small example shows why this matters. Imagine 10,000 delivered emails create 400 total replies (4%). If only 80 are positive (0.8%), and only half of those become held meetings, you’re at 40 real conversations. That number tends to predict pipeline, not the 4% reply rate.
To connect the funnel to revenue, you also need two consistent inputs: revenue per deal (average contract value or average first payment) and a time window. Outbound has lag. A month of sends might produce meetings this month, opportunities next month, and closes next quarter.
Build your model around the period you operate on weekly (often monthly for activity, quarterly for revenue), then add a simple sales-cycle assumption so you don’t “count” revenue before it can realistically close.
The core rates to track (keep it to 5 numbers)
You don’t need dozens of metrics. Five rates can carry the whole funnel, as long as each one sits between two stages you can count.
- Delivery rate = delivered / sent
- Positive reply rate = positive replies / delivered
- Meeting booked rate = meetings booked / positive replies
- Show rate = meetings held / meetings booked
- Close rate = closed-won / opportunities
Keep denominators obvious. Using delivered instead of sent removes bounces and failed delivery from performance math.
Two rules keep the model stable:
First, define “positive” once and stick to it. If you change what counts as positive week to week, your model will swing wildly.
Second, improve the weakest rate first. If delivery is 95% and positive replies are 2%, but only 25% of positives become meetings, your fastest win is usually improving the meeting booked rate (better follow-ups, clearer call to action, faster replies), not sending more emails.
With these five numbers, you can translate “we sent 10,000 emails” into “we expect X meetings, Y opportunities, and Z deals” without pretending reply rate equals revenue.
Build the spreadsheet model step by step
A useful model starts with inputs you can control and measure. Put them at the top of the sheet, then let the funnel math do the rest.
Start with:
- Sends (emails sent in the period)
- Delivery rate (percent delivered, not bounced)
- Positive reply rate (percent of delivered that show intent)
- Meeting booked rate (percent of positive replies that become a meeting)
- Opportunity rate and close rate (your sales conversion rates)
Add cost inputs next to them: cost per lead (if you pay for data), hours spent, hourly cost (or fully loaded SDR cost), and tooling cost. Then add ACV (average contract value) or average deal value.
Step 1: from sent to delivered
Delivered = Sends x Delivery rate
If you don’t track delivery rate, you’re guessing. Bounces quietly ruin the rest of the math.
Step 2: from delivered to meetings
Positive replies = Delivered x Positive reply rate
Meetings = Positive replies x Meeting booked rate
If you already track “meetings per delivered,” you can skip the middle and use Meetings = Delivered x Meeting rate. Keeping the middle step usually helps you see what’s breaking: maybe copy creates interest, but follow-up doesn’t convert to calendar time.
Step 3: from meetings to revenue
Opportunities = Meetings x Opportunity rate
Closed deals = Opportunities x Close rate
Revenue = Closed deals x ACV
Optional: Gross profit = Revenue x Gross margin (if you want profit-based ROI).
Add ROI and payback
Total cost = (Leads x Cost per lead) + (Hours x Hourly cost) + Tooling cost
ROI = (Revenue - Total cost) / Total cost
CAC payback (simple) = Total cost / Monthly gross profit
A spreadsheet-ready funnel template layout
Set up your sheet to answer one question quickly: if you change volume or quality this week, what happens to meetings and revenue a few weeks later?
Create one tab per campaign (for example, “IT services SMB” vs “Recruiting agencies”). Use rows for time periods. Weekly rows usually work best because they match how teams operate and review results. Monthly rows are fine if your sales cycle is slow.
For columns, keep raw counts separate from calculated rates. A clean order is activity, then meeting outcomes, then pipeline and revenue:
- Activity: Sent, Delivered
- Responses: Interested, Other replies, Bounces/Unsubs
- Meetings: Meetings booked, Meetings held
- Pipeline: Opportunities created, Wins
- Money: Average deal size, Revenue
Keep an “Assumptions” area to the side with the small set of rates you want to edit in one place (delivery, interested rate, booked-from-interested, held-from-booked, win rate, average deal size). Your weekly rows should pull from that block so you can run scenarios without rewriting formulas.
Add costs in a small block (fixed monthly plus variable per lead), and reference them in an ROI cell. Include a Notes column on every row. Write down what changed: list source, offer, subject lines, or sending setup. That’s what makes spikes and drops explainable later.
Forecasting: best case, base case, worst case
Forecasting turns your outbound ROI model into a planning tool. The goal isn’t to be perfect. It’s to plan safely with a base case, protect yourself with a worst case, and understand what upside looks like.
Pick three versions of the few rates that drive the funnel. Base case should reflect what you can repeat for the next few weeks. Worst case should assume something goes wrong (list quality dips, deliverability slips, or prospects are slower to reply). Best case should be a good month, not a miracle.
A quick sensitivity table you can paste into a sheet
Instead of guessing outcomes from reply rate, forecast from delivered emails to meetings and wins. “Meetings per delivered” is often the most useful single rate because it captures both targeting and message fit.
| Monthly sends | Delivered % | Meetings per delivered | Wins per meeting | Forecast meetings | Forecast wins |
|---|---|---|---|---|---|
| 5,000 | 90% | 0.6% | 20% | =A2B2C2 | =E2*D2 |
| 10,000 | 90% | 0.6% | 20% | =A3B3C3 | =E3*D3 |
| 15,000 | 90% | 0.6% | 20% | =A4B4C4 | =E4*D4 |
To turn this into best, base, worst, duplicate the table three times or add three columns for each rate.
Pick a send plan your team can handle
Forecasting only helps if you can absorb the results. If your base case says 30 meetings next month but your team can only run 12, you’ll waste leads.
Plan from capacity backwards: how many meetings can you run, how many convert to opportunities, and how many deals can you support at once.
Example scenario with real numbers (simple and realistic)
Say you run a cold email campaign for 30 days and end up with 10,000 delivered emails.
Assumptions:
- Reply rate: 3%
- Interested share of replies: 25%
- Meeting booked rate (from interested replies): 60%
- Show rate: 70%
- Close rate (from opportunities): 25%
Now turn that into outcomes:
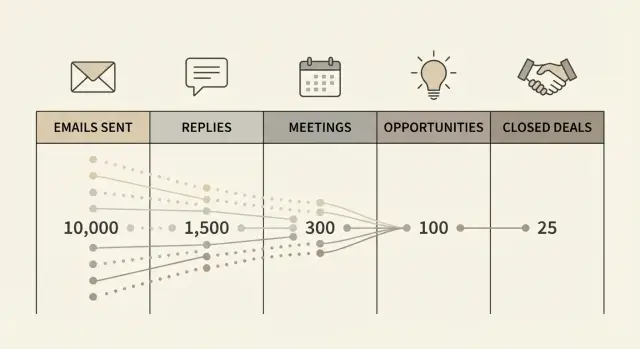
10,000 delivered x 3% reply rate = 300 replies
300 replies x 25% interested = 75 interested replies
75 interested x 60% booked = 45 meetings booked
45 booked x 70% show rate = 32 meetings held (rounded)
If half of held meetings become opportunities, that’s 16 opportunities
16 opportunities x 25% close rate = 4 wins
If your average deal is $5,000, the month produces about $20,000 in revenue.
Why small changes matter
Chasing volume can hide the easiest wins: improving later-stage conversion.
Raise the show rate from 70% to 85% (better reminders, clearer agenda, tighter qualification). 45 booked x 85% = 38 held. At the same downstream rates, that becomes about 5 wins instead of 4. With a $5,000 average deal, that’s roughly +$5,000 without sending a single extra email.
Or raise the close rate from 25% to 35% (better offer, better follow-up, better handoff). 16 opportunities x 35% = 6 wins. That’s about +$10,000.
List quality beats pure volume
A smaller, sharper list often wins because it lifts the interested share and the close rate. Even if reply rate stays the same, better fit usually means fewer “not interested” replies and more real conversations.
Common mistakes that break outbound ROI math
Most outbound spreadsheets look fine until you compare them to real pipeline and realize the model was counting the wrong things.
What to count (and what not to)
The easiest way to inflate results is to treat every reply as progress. A “not interested” or “remove me” reply can be useful (it cleans your list), but it shouldn’t move the revenue funnel.
Sanity-check each stage with one question: does this number represent a real next step toward revenue, or just activity?
Common errors:
- Counting all replies instead of separating interested replies from everything else
- Assuming all sends were delivered and ignoring bounces or blocks
- Mixing time windows (meetings booked this month, revenue closing next quarter)
- Treating booked meetings as held meetings
- Forgetting real costs (data, domains, mailboxes, warm-up, and the hours spent running campaigns)
A simple scenario: you send 5,000 emails and get 200 replies. That sounds great until you see only 25 are actually interested, 10 meetings are booked, and only 6 are held. If your sheet uses 200 as the “success” number, every downstream forecast will be wrong.
Costs and timing
Two things quietly distort ROI: timing and costs.
Outbound has lag. Leads reply this week, meetings happen next week, opportunities are created later, and deals close later still. If you don’t match each stage to the same cohort (the same send period), conversion rates become noise.
And if you only include software fees, ROI will look unreal. Add at least a basic labor estimate (hours per week times hourly cost) and outreach inputs like prospect data and sending setup.
Quick checklist before you trust the numbers
Before you treat your spreadsheet as a forecast, make sure the inputs are real.
Start with the volume you actually reached. “Sent” is what your tool attempted. What you can count on is delivered mail (or at least sent minus hard bounces).
Then clean up replies so you don’t confuse activity with intent. Your model should use an interested reply rate (positive intent) as the input that leads to meetings.
A quick quality check:
- Use delivered messages as the starting number and confirm domain health is stable
- Split replies by intent (interested vs not interested vs auto/out-of-office/unsubscribe)
- Separate meetings booked from meetings held
- Confirm opportunities and closed-won deals are tagged with the correct source
- Update assumptions using recent data (last 30 days is a solid default)
If you book 40 meetings but only 20 are held, using booked meetings in your model will double your expected pipeline. That leads to over-sending, over-hiring, or over-promising.
Next steps: turn the model into a weekly operating rhythm
Pick one campaign and model only that first. Use a single offer, one audience, and one sending setup so the numbers mean something. Then backfill the last four weeks of actuals: sends, deliveries, positive replies, meetings booked, meetings held, opportunities, and closed-won.
Keep the cadence simple: update once a week, same day, same time. You’re looking for trend and leakage, not perfection.
A lightweight weekly routine:
- Update last week’s actuals and refresh the next 2 to 4 week forecast
- Compare forecast vs actual for meetings held and opportunities created
- Write down one hypothesis for the biggest gap
- Test one change next week (one lever only)
- Define success as a number (for example, +0.5% meeting booked rate)
Improve one rate at a time. If you change three things at once, you won’t know what helped.
If you want cleaner inputs with less manual sorting, using an all-in-one outbound platform like LeadTrain (leadtrain.app) can help because domains, mailboxes, warm-up, sequences, and reply classification live in one place. That makes it easier to keep “delivered” and “interested” consistent, which is what your ROI math depends on.
FAQ
Why is reply rate a bad success metric for cold email?
Reply rate only tells you that people reacted, not that they moved closer to buying. A campaign can generate lots of replies like “not a fit,” “stop emailing me,” or “wrong person” and still produce zero meetings and zero pipeline.
What should I track instead of reply rate to measure outbound ROI?
Start with delivered emails, then track positive replies, meetings booked, meetings held, opportunities created, and closed deals. Those stages map to real revenue instead of just engagement.
What counts as a “positive reply” in an outbound ROI model?
A positive reply shows intent to talk or learn more, like asking for details or agreeing to a call. “Not interested,” unsubscribes, wrong person, out-of-office, and bounces shouldn’t be counted as positives because they don’t create pipeline.
Why should the funnel start with delivered emails, not sent emails?
Use delivered so bounces and blocked messages don’t pollute your conversion rates. If you model from sent, you can “improve” performance just by ignoring deliverability problems, which makes forecasts unreliable.
What are the 5 core rates I should track in my spreadsheet?
A simple, stable set is delivery rate, positive reply rate, meeting booked rate from positive replies, show rate, and close rate. These five numbers usually let you forecast meetings and revenue without drowning in metrics.
How do I keep my “positive reply” definition consistent over time?
Define it once in plain language and keep it consistent week to week. If you change the definition to make results look better, your trend breaks and your forecast stops matching reality.
Why does “meetings held” matter more than “meetings booked”?
Booked meetings inflate results because some no-show or get rescheduled endlessly. Held meetings reflect real conversations, so they predict opportunities and revenue much more accurately.
How do I handle the time lag between sending emails and closing revenue?
Pick a time window for activity (often weekly or monthly) and accept that revenue closes later. Tie conversions back to the same send cohort so you’re not mixing meetings from this month with deals from a different period.
If my reply rate is fine but revenue is flat, what should I improve first?
Fix the biggest leak closest to revenue that’s under your control, often converting positive replies into booked and held meetings. Improving follow-up speed, clarity of the call to action, and qualification can lift meetings without increasing send volume.
What costs should I include so my outbound ROI isn’t inflated?
Count data, labor, and sending costs, not just software. A basic model that includes hours spent running campaigns plus lead/data costs will keep your ROI honest even if the topline metrics look strong.